


Mappa antica dell'attività dei tornado negli Stati Uniti 1930-1974 di Fujita & Pearson: Percorsi, statistiche sui decessi, Tornado Alley
L’offerta del Collezionista
Scegli due opere idonee e ricevi il 20% di sconto su entrambe. Scegline tre e quella al prezzo più basso è in omaggio, con un risparmio massimo del 33%.
Abbina liberamente mappe standard idonee e stampe d’arte fine art. Non è richiesto alcun codice; l’offerta viene applicata automaticamente al checkout.
Sono incluse le configurazioni standard su ordinazione. Sono esclusi formati su misura, design personalizzati e lavori su commissione.
Hai bisogno di consegne a indirizzi diversi? Contattaci prima di effettuare l’ordine.L’offerta del Collezionista
Scegli due opere idonee e ricevi il 20% di sconto su entrambe. Scegline tre e quella al prezzo più basso è in omaggio, con un risparmio massimo del 33%.
Abbina liberamente mappe standard idonee e stampe d’arte fine art. Non è richiesto alcun codice; l’offerta viene applicata automaticamente al checkout.
Sono incluse le configurazioni standard su ordinazione. Sono esclusi formati su misura, design personalizzati e lavori su commissione.
Hai bisogno di consegne a indirizzi diversi? Contattaci prima di effettuare l’ordine.
Restaurata dalla mappa originale del 1974 e stampata in qualità museale. Leggi la storia dietro questa mappa
Choose your size
Choose your finish


(Maggiori informazioni)
Gift message & custom finish

If you want to add a gift message, or a finish (jigsaw, aluminium board, etc.) that is not available here, please request it in the "order note" when you check out.
Every order is custom made, so if you need the size adjusted slightly, or printed on an unusual material, just let us know. We've done thousands of custom orders over the years, so there's (almost) nothing we can't manage.
You can also contact us before you order, if you prefer!

- Prodotto localmente. Consegna sicura
- Nessun dazio o costo nascosto
- Serve aiuto? Chiamaci o messaggio su WhatsApp
Own a piece of history
8,000+ five-star reviews


Questa notevole mappa tematica, intitolata "Tornado negli Stati Uniti, 1930-74," offre una cronaca visivamente accattivante di quasi mezzo secolo di attività tornadica...
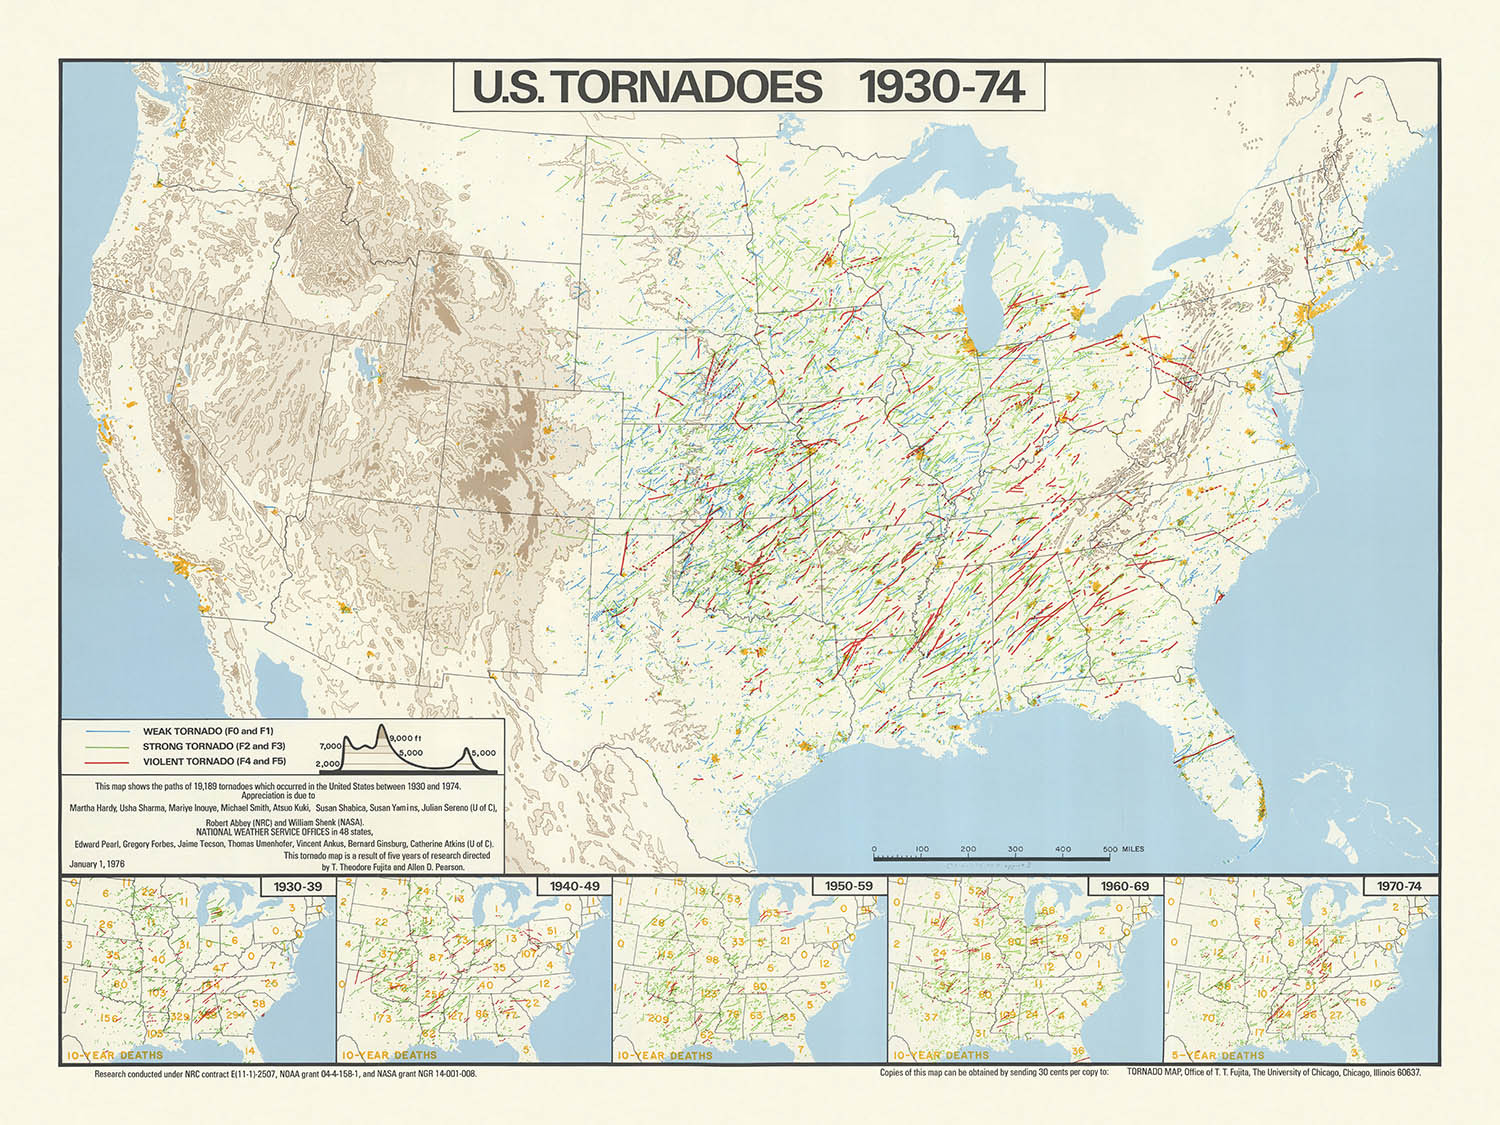
Continua a leggereQuesta notevole mappa tematica, intitolata "Tornado negli Stati Uniti, 1930-74," offre una cronaca visivamente accattivante di quasi mezzo secolo di attività tornadica negli Stati Uniti contigui. Creata nel 1974 dai rinomati meteorologi T. Theodore Fujita e Allen D. Pearson, la mappa presenta i percorsi di 19.189 tornado, tessendo un arazzo denso e intricato di storia meteorologica. Il focus principale è sulla frequenza, distribuzione e impatto umano dei tornado, rendendo questa mappa non solo un traguardo cartografico ma anche un'affermazione profonda sull'intersezione tra forze naturali e vite umane.
Al centro di questa mappa si trova un uso magistrale delle tecniche infografiche. Ogni percorso di tornado è tracciato meticolosamente, risultando in una drammatica concentrazione di linee che attira immediatamente l'occhio sull'infame "Tornado Alley" degli Stati Uniti centrali. Il design della mappa equilibra elegantemente chiarezza e densità, utilizzando caratteristiche di sfondo sottili come i confini statali, i fiumi principali e i Grandi Laghi per fornire orientamento senza distrarre dai dati centrali. Questo approccio riflette le migliori tradizioni della cartografia scientifica degli anni '70, dove funzione e forma sono armoniosamente intrecciate.
Ciò che eleva veramente questa mappa è la sua integrazione di riquadri statistici, che tracciano le fatalità legate ai tornado per decennio dal 1930 al 1974. Queste cinque mappe in insetto forniscono un controcanto sobrio ai percorsi vorticosi dei tornado, contestualizzando il costo umano di questi disastri naturali. L'inclusione di queste infografiche trasforma la mappa da un semplice registro di eventi meteorologici in un'esplorazione sfumata del rischio, della resilienza e dell'evoluzione della sicurezza pubblica di fronte all'imprevedibilità della natura.
I creatori della mappa, T. Theodore Fujita e Allen D. Pearson, sono figure leggendarie nel campo della ricerca sul maltempo. Fujita, in particolare, è rinomato per aver sviluppato la scala Fujita, che rimane uno strumento fondamentale per valutare l'intensità dei tornado. La loro collaborazione su questa mappa non solo le conferisce autorità scientifica, ma segna anche un momento cruciale nella storia della meteorologia, poiché i ricercatori hanno iniziato a sfruttare i dati visivi per comunicare schemi complessi e guidare la comprensione pubblica.
Oltre al suo immediato valore scientifico, questa mappa si erge come un artefatto culturale e storico. Cattura un periodo di trasformazione nella meteorologia americana, quando i progressi nella raccolta e analisi dei dati hanno cominciato a fornire nuove intuizioni sui modelli di clima estremo. Per collezionisti, storici e appassionati di meteorologia, questa mappa offre sia un'istantanea di un'era definente che una testimonianza del potere duraturo della cartografia di illuminare le forze che plasmano il nostro mondo.
Luoghi su questa mappa
- Stati Uniti d'America (48 stati contigui)
- Texas
- Oklahoma
- Kansas
- Nebraska
- Iowa
- Missouri
- Arkansas
- Illinois
- Indiana
- Ohio
- Fiume Mississippi
- Grandi Laghi (Lago Superiore, Lago Michigan, Lago Huron, Lago Erie, Lago Ontario)
- Montagne Appalache
- Stati sudorientali (ad esempio, Alabama, Mississippi, Georgia, Tennessee)
- Regione delle Grandi Pianure (Tornado Alley)
- Stati Uniti occidentali (meno attività tornadica)
- Stati Uniti nordorientali (meno attività tornadica)
- Confini statali (tutti gli stati contigui degli Stati Uniti)
- Divisioni regionali degli Stati Uniti (Midwest, Sud, Pianure, Sud-est)
- Confini con Canada e Messico
- Golfo del Messico (confine meridionale)
Caratteristiche e punti di riferimento notevoli
- Fitti gruppi di percorsi di tornado, specialmente negli Stati Uniti centrali (Tornado Alley)
- Percorsi di tornado chiaramente contrassegnati, ciascuno rappresentante un evento di tornado individuale
- Cinque mappe in miniatura, ciascuna raffigurante i decessi legati ai tornado per decennio (1930-39, 1940-49, 1950-59, 1960-69, 1970-74)
- Fiumi principali, come il fiume Mississippi, sono rappresentati per aiutare l'orientamento geografico
- I Grandi Laghi sono mostrati come corpi idrici principali
- Le Montagne Appalache sono visibili, fungendo da riferimento geografico
- La legenda della mappa spiega i simboli e le linee usati per i percorsi dei tornado e le statistiche sui decessi
- Il titolo della mappa e i crediti a T. Theodore Fujita e Allen D. Pearson sono ben visibili
- La densità più alta di percorsi di tornado appare in stati come Texas, Oklahoma, Kansas, Nebraska e Iowa
- Minore densità di percorsi di tornado negli Stati Uniti occidentali e nord-orientali
- Il sud-est degli Stati Uniti mostra anche un numero notevole di percorsi di tornado
- Le mappe in miniatura usano ombreggiature o punti per mostrare il numero di decessi legati ai tornado per stato o regione
- La mappa utilizza colori contrastanti o pesi delle linee per distinguere i percorsi dei tornado da altre caratteristiche
- Il design complessivo è denso di dati, enfatizzando la frequenza e la distribuzione dei tornado
- La mappa include una barra di scala per riferimento
- I percorsi dei tornado a volte attraversano i confini statali, illustrando la natura ampia di alcuni tornado
- La mappa è orientata con il nord in alto, seguendo le convenzioni cartografiche standard
Contesto storico e di design
- Nome della mappa: Tornado negli Stati Uniti, 1930-74
- Creata da T. Theodore Fujita e Allen D. Pearson nel 1974
- Mappa infografica tematica, focalizzata sulle occorrenze di tornado negli Stati Uniti
- Visualizza i percorsi di 19.189 tornado che si sono verificati negli Stati Uniti tra il 1930 e il 1974
- Include insets che mostrano i decessi legati ai tornado per cinque diversi decenni: 1930-39, 1940-49, 1950-59, 1960-69 e 1970-74
- La scala della mappa è approssimativamente 1:6.000.000
- Autori della mappa: T. Theodore Fujita, un meteorologo pionieristico noto per lo sviluppo della scala Fujita (scala F) per l'intensità dei tornado, e Allen D. Pearson, una figura nota nella ricerca sui fenomeni meteorologici estremi
- Pubblicata nel 1974, poco dopo il devastante Super Outbreak del 1974, uno dei più grandi eventi di tornado nella storia degli Stati Uniti
- La mappa è un prodotto di un periodo in cui la documentazione e la ricerca sui tornado stavano diventando più sistematiche, con un uso crescente dei dati meteorologici
- Fornisce un riassunto visivo unico di oltre quattro decenni di attività tornadica, enfatizzando la frequenza e la distribuzione dei percorsi dei tornado
- Tematicamente, la mappa affronta i pericoli naturali, specificamente i tornado, e il loro impatto sulla vita umana
- Le mappe in miniatura forniscono un prezioso contesto storico sui cambiamenti nei modelli di mortalità legati ai tornado nel tempo
- La mappa probabilmente ha servito come strumento di ricerca e risorsa di sensibilizzazione pubblica durante un periodo di crescente interesse per la preparazione ai disastri
- Il design utilizza linee dense e sovrapposte per rappresentare i percorsi dei tornado, trasmettendo visivamente la concentrazione di attività tornadica in alcune regioni
- Mettere in evidenza la regione "Tornado Alley" nel centro degli Stati Uniti, nota per la sua alta frequenza di tornado
- Riflette lo stato della scienza meteorologica e della raccolta dati nella metà del XX secolo
- La creazione della mappa riflette una crescente collaborazione tra meteorologi e cartografi per la comunicazione pubblica
- Significato storico: rappresenta una delle prime visualizzazioni complete dei dati sui tornado negli Stati Uniti.
- Il periodo dei dati (1930-1974) include significativi progressi tecnologici e metodologici nell'osservazione del tempo
- La mappa fornisce una base per confrontare l'attività dei tornado prima e dopo l'implementazione dei moderni sistemi di allerta
- Funziona come un documento storico, mostrando l'evoluzione sia della ricerca sui tornado che degli sforzi per la sicurezza pubblica
- La mappa avrebbe contribuito alla comprensione pubblica dei rischi dei tornado e influenzato politiche e codici edilizi nelle aree soggette a tornado
- Lo stile della mappa è caratteristico delle infografiche degli anni '70, con un focus sulla chiarezza e sulla visualizzazione densa dei dati
- L'inclusione delle statistiche sui decessi contestualizza il costo umano dei tornado, non solo la loro frequenza
- La mappa è un esempio precoce di mappatura tematica in meteorologia, precedente all'adozione diffusa dei GIS
- La pubblicazione della mappa da parte di importanti ricercatori sui tornado le conferisce ulteriore credibilità scientifica
- L'approccio infografico rende i complessi dati meteorologici accessibili a un pubblico più ampio
- Il focus della mappa sugli Stati Uniti riflette la vulnerabilità unica del paese ai tornado a causa della geografia e del clima
- La mappa non include Alaska, Hawaii o territori statunitensi, concentrandosi esclusivamente sugli stati contigui
Si prega di controllare attentamente le immagini per assicurarsi che una specifica città o luogo sia mostrato su questa mappa. Puoi anche contattarci e chiedere di controllare la mappa per te.
Questa mappa appare fantastica in ogni dimensione, ma consiglio sempre di optare per una dimensione più grande se hai spazio. In questo modo puoi facilmente distinguere tutti i dettagli.
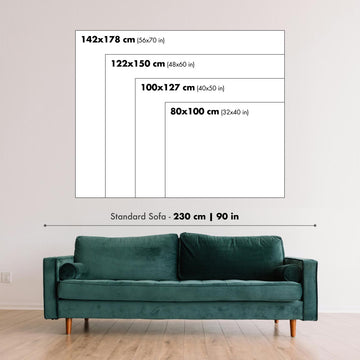
Questa mappa sembra incredibile in dimensioni fino a 90 pollici (230 cm). Se stai cercando una mappa più grande, per favore contattaci.
Il modello nelle immagini dell'annuncio sta tenendo la versione 18x24 pollici (45x60 cm) di questa mappa.
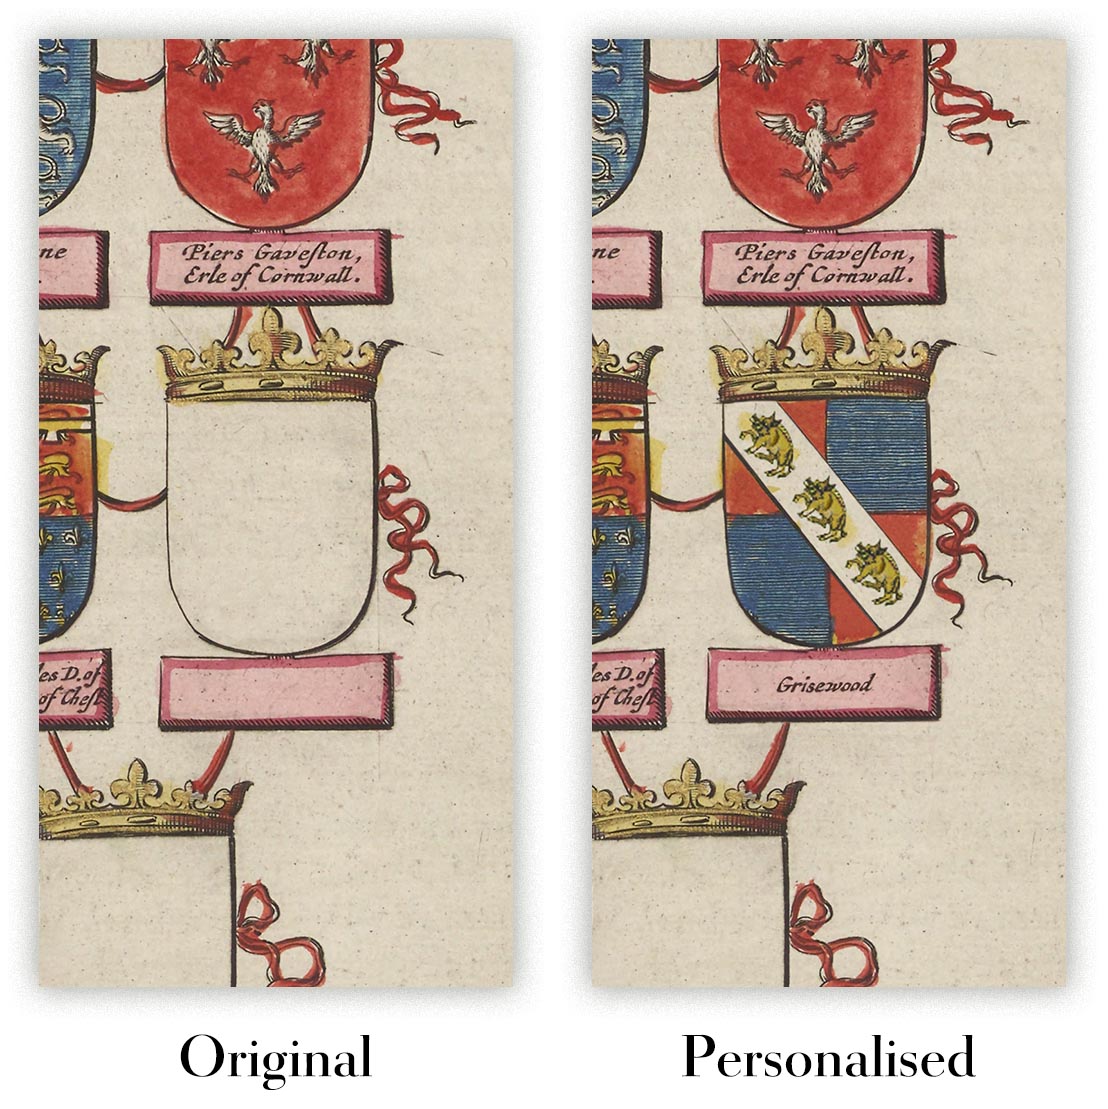
La quinta immagine dell'annuncio mostra un esempio del mio servizio di personalizzazione della mappa.
Se stai cercando qualcosa di leggermente diverso, dai un'occhiata alla mia collezione delle migliori vecchie mappe per vedere se qualcosa attira la tua attenzione.
Per favore contattami per controllare se una certa posizione, punto di riferimento o caratteristica è mostrata su questa mappa.
Questo sarebbe un meraviglioso regalo di compleanno, Natale, Festa del Papà, partenza dal lavoro, anniversario o per la casa per qualcuno delle aree coperte da questa mappa.
Questa mappa è disponibile come stampa giclée su carta opaca archiviata senza acidi, oppure puoi acquistarla incorniciata. La cornice è una semplice cornice nera che si adatta alla maggior parte degli stili. Ti prego di contattarci se desideri un colore o materiale della cornice diverso. Le mie cornici sono dotate di un acrilico museo super chiaro (perspex/acrylite), che è significativamente meno riflettente del vetro, più sicuro e arriverà sempre in perfette condizioni.
This map is also available as a float framed canvas, sometimes known as a shadow gap framed canvas or canvas floater. The map is printed on artist's cotton canvas and then stretched over a handmade box frame. We then "float" the canvas inside a wooden frame, which is available in a range of colours (black, dark brown, oak, antique gold and white). This is a wonderful way to present a map without glazing in front. See some examples of float framed canvas maps and explore the differences between my different finishes.
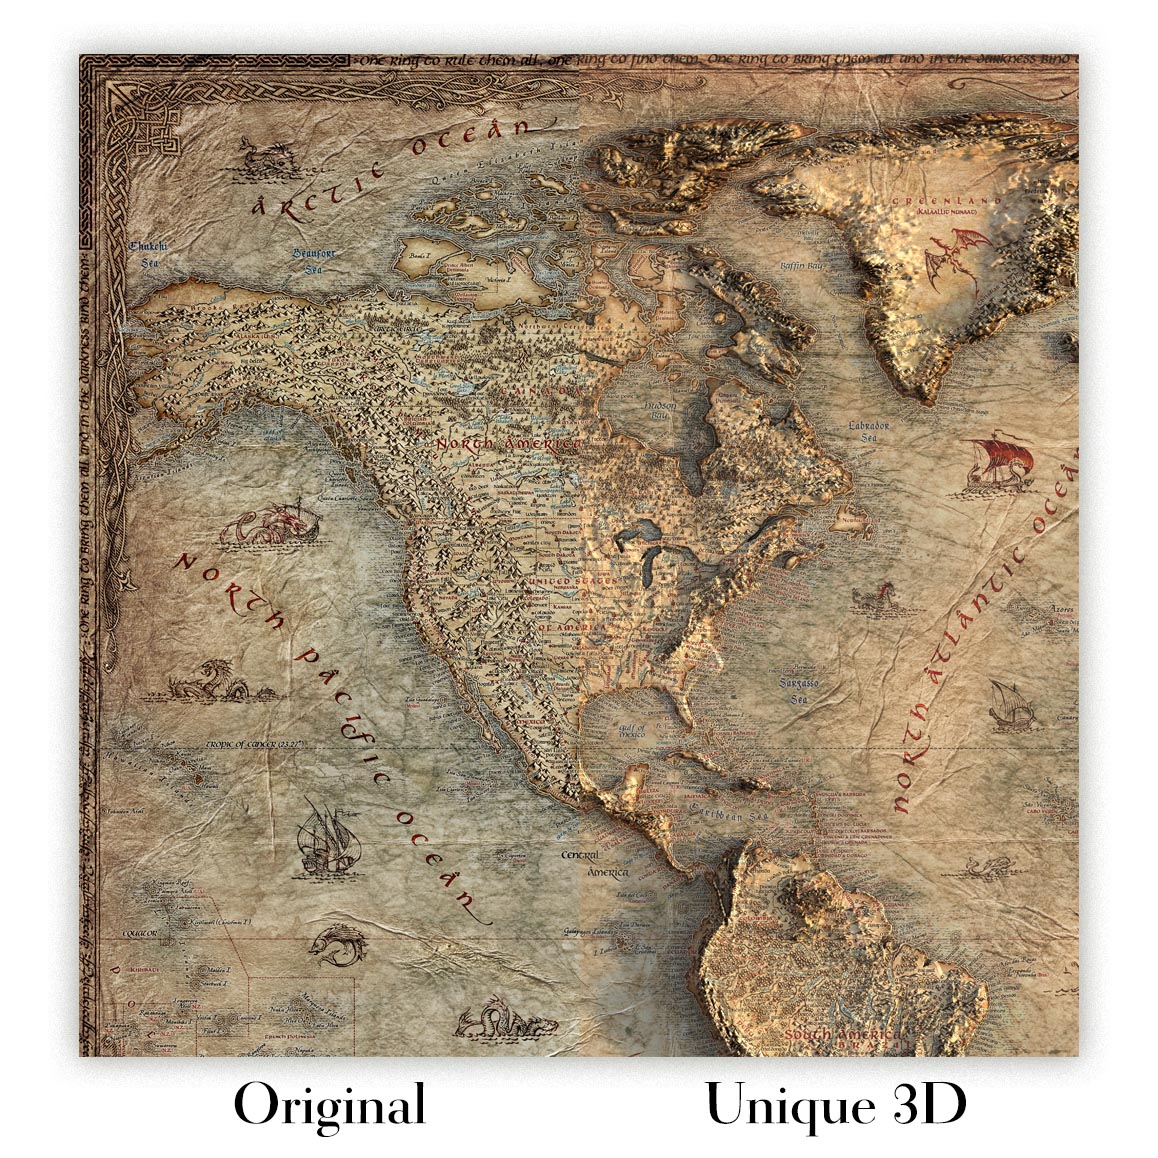
For something truly unique, this map is also available in "Unique 3D", our trademarked process that dramatically transforms the map so that it has a wonderful sense of depth. We combine the original map with detailed topography and elevation data, so that mountains and the terrain really "pop". For more info and examples of 3D maps, check my Unique 3D page.
Questa notevole mappa tematica, intitolata "Tornado negli Stati Uniti, 1930-74," offre una cronaca visivamente accattivante di quasi mezzo secolo di attività tornadica negli Stati Uniti contigui. Creata nel 1974 dai rinomati meteorologi T. Theodore Fujita e Allen D. Pearson, la mappa presenta i percorsi di 19.189 tornado, tessendo un arazzo denso e intricato di storia meteorologica. Il focus principale è sulla frequenza, distribuzione e impatto umano dei tornado, rendendo questa mappa non solo un traguardo cartografico ma anche un'affermazione profonda sull'intersezione tra forze naturali e vite umane.
Al centro di questa mappa si trova un uso magistrale delle tecniche infografiche. Ogni percorso di tornado è tracciato meticolosamente, risultando in una drammatica concentrazione di linee che attira immediatamente l'occhio sull'infame "Tornado Alley" degli Stati Uniti centrali. Il design della mappa equilibra elegantemente chiarezza e densità, utilizzando caratteristiche di sfondo sottili come i confini statali, i fiumi principali e i Grandi Laghi per fornire orientamento senza distrarre dai dati centrali. Questo approccio riflette le migliori tradizioni della cartografia scientifica degli anni '70, dove funzione e forma sono armoniosamente intrecciate.
Ciò che eleva veramente questa mappa è la sua integrazione di riquadri statistici, che tracciano le fatalità legate ai tornado per decennio dal 1930 al 1974. Queste cinque mappe in insetto forniscono un controcanto sobrio ai percorsi vorticosi dei tornado, contestualizzando il costo umano di questi disastri naturali. L'inclusione di queste infografiche trasforma la mappa da un semplice registro di eventi meteorologici in un'esplorazione sfumata del rischio, della resilienza e dell'evoluzione della sicurezza pubblica di fronte all'imprevedibilità della natura.
I creatori della mappa, T. Theodore Fujita e Allen D. Pearson, sono figure leggendarie nel campo della ricerca sul maltempo. Fujita, in particolare, è rinomato per aver sviluppato la scala Fujita, che rimane uno strumento fondamentale per valutare l'intensità dei tornado. La loro collaborazione su questa mappa non solo le conferisce autorità scientifica, ma segna anche un momento cruciale nella storia della meteorologia, poiché i ricercatori hanno iniziato a sfruttare i dati visivi per comunicare schemi complessi e guidare la comprensione pubblica.
Oltre al suo immediato valore scientifico, questa mappa si erge come un artefatto culturale e storico. Cattura un periodo di trasformazione nella meteorologia americana, quando i progressi nella raccolta e analisi dei dati hanno cominciato a fornire nuove intuizioni sui modelli di clima estremo. Per collezionisti, storici e appassionati di meteorologia, questa mappa offre sia un'istantanea di un'era definente che una testimonianza del potere duraturo della cartografia di illuminare le forze che plasmano il nostro mondo.
Luoghi su questa mappa
- Stati Uniti d'America (48 stati contigui)
- Texas
- Oklahoma
- Kansas
- Nebraska
- Iowa
- Missouri
- Arkansas
- Illinois
- Indiana
- Ohio
- Fiume Mississippi
- Grandi Laghi (Lago Superiore, Lago Michigan, Lago Huron, Lago Erie, Lago Ontario)
- Montagne Appalache
- Stati sudorientali (ad esempio, Alabama, Mississippi, Georgia, Tennessee)
- Regione delle Grandi Pianure (Tornado Alley)
- Stati Uniti occidentali (meno attività tornadica)
- Stati Uniti nordorientali (meno attività tornadica)
- Confini statali (tutti gli stati contigui degli Stati Uniti)
- Divisioni regionali degli Stati Uniti (Midwest, Sud, Pianure, Sud-est)
- Confini con Canada e Messico
- Golfo del Messico (confine meridionale)
Caratteristiche e punti di riferimento notevoli
- Fitti gruppi di percorsi di tornado, specialmente negli Stati Uniti centrali (Tornado Alley)
- Percorsi di tornado chiaramente contrassegnati, ciascuno rappresentante un evento di tornado individuale
- Cinque mappe in miniatura, ciascuna raffigurante i decessi legati ai tornado per decennio (1930-39, 1940-49, 1950-59, 1960-69, 1970-74)
- Fiumi principali, come il fiume Mississippi, sono rappresentati per aiutare l'orientamento geografico
- I Grandi Laghi sono mostrati come corpi idrici principali
- Le Montagne Appalache sono visibili, fungendo da riferimento geografico
- La legenda della mappa spiega i simboli e le linee usati per i percorsi dei tornado e le statistiche sui decessi
- Il titolo della mappa e i crediti a T. Theodore Fujita e Allen D. Pearson sono ben visibili
- La densità più alta di percorsi di tornado appare in stati come Texas, Oklahoma, Kansas, Nebraska e Iowa
- Minore densità di percorsi di tornado negli Stati Uniti occidentali e nord-orientali
- Il sud-est degli Stati Uniti mostra anche un numero notevole di percorsi di tornado
- Le mappe in miniatura usano ombreggiature o punti per mostrare il numero di decessi legati ai tornado per stato o regione
- La mappa utilizza colori contrastanti o pesi delle linee per distinguere i percorsi dei tornado da altre caratteristiche
- Il design complessivo è denso di dati, enfatizzando la frequenza e la distribuzione dei tornado
- La mappa include una barra di scala per riferimento
- I percorsi dei tornado a volte attraversano i confini statali, illustrando la natura ampia di alcuni tornado
- La mappa è orientata con il nord in alto, seguendo le convenzioni cartografiche standard
Contesto storico e di design
- Nome della mappa: Tornado negli Stati Uniti, 1930-74
- Creata da T. Theodore Fujita e Allen D. Pearson nel 1974
- Mappa infografica tematica, focalizzata sulle occorrenze di tornado negli Stati Uniti
- Visualizza i percorsi di 19.189 tornado che si sono verificati negli Stati Uniti tra il 1930 e il 1974
- Include insets che mostrano i decessi legati ai tornado per cinque diversi decenni: 1930-39, 1940-49, 1950-59, 1960-69 e 1970-74
- La scala della mappa è approssimativamente 1:6.000.000
- Autori della mappa: T. Theodore Fujita, un meteorologo pionieristico noto per lo sviluppo della scala Fujita (scala F) per l'intensità dei tornado, e Allen D. Pearson, una figura nota nella ricerca sui fenomeni meteorologici estremi
- Pubblicata nel 1974, poco dopo il devastante Super Outbreak del 1974, uno dei più grandi eventi di tornado nella storia degli Stati Uniti
- La mappa è un prodotto di un periodo in cui la documentazione e la ricerca sui tornado stavano diventando più sistematiche, con un uso crescente dei dati meteorologici
- Fornisce un riassunto visivo unico di oltre quattro decenni di attività tornadica, enfatizzando la frequenza e la distribuzione dei percorsi dei tornado
- Tematicamente, la mappa affronta i pericoli naturali, specificamente i tornado, e il loro impatto sulla vita umana
- Le mappe in miniatura forniscono un prezioso contesto storico sui cambiamenti nei modelli di mortalità legati ai tornado nel tempo
- La mappa probabilmente ha servito come strumento di ricerca e risorsa di sensibilizzazione pubblica durante un periodo di crescente interesse per la preparazione ai disastri
- Il design utilizza linee dense e sovrapposte per rappresentare i percorsi dei tornado, trasmettendo visivamente la concentrazione di attività tornadica in alcune regioni
- Mettere in evidenza la regione "Tornado Alley" nel centro degli Stati Uniti, nota per la sua alta frequenza di tornado
- Riflette lo stato della scienza meteorologica e della raccolta dati nella metà del XX secolo
- La creazione della mappa riflette una crescente collaborazione tra meteorologi e cartografi per la comunicazione pubblica
- Significato storico: rappresenta una delle prime visualizzazioni complete dei dati sui tornado negli Stati Uniti.
- Il periodo dei dati (1930-1974) include significativi progressi tecnologici e metodologici nell'osservazione del tempo
- La mappa fornisce una base per confrontare l'attività dei tornado prima e dopo l'implementazione dei moderni sistemi di allerta
- Funziona come un documento storico, mostrando l'evoluzione sia della ricerca sui tornado che degli sforzi per la sicurezza pubblica
- La mappa avrebbe contribuito alla comprensione pubblica dei rischi dei tornado e influenzato politiche e codici edilizi nelle aree soggette a tornado
- Lo stile della mappa è caratteristico delle infografiche degli anni '70, con un focus sulla chiarezza e sulla visualizzazione densa dei dati
- L'inclusione delle statistiche sui decessi contestualizza il costo umano dei tornado, non solo la loro frequenza
- La mappa è un esempio precoce di mappatura tematica in meteorologia, precedente all'adozione diffusa dei GIS
- La pubblicazione della mappa da parte di importanti ricercatori sui tornado le conferisce ulteriore credibilità scientifica
- L'approccio infografico rende i complessi dati meteorologici accessibili a un pubblico più ampio
- Il focus della mappa sugli Stati Uniti riflette la vulnerabilità unica del paese ai tornado a causa della geografia e del clima
- La mappa non include Alaska, Hawaii o territori statunitensi, concentrandosi esclusivamente sugli stati contigui
Si prega di controllare attentamente le immagini per assicurarsi che una specifica città o luogo sia mostrato su questa mappa. Puoi anche contattarci e chiedere di controllare la mappa per te.
Questa mappa appare fantastica in ogni dimensione, ma consiglio sempre di optare per una dimensione più grande se hai spazio. In questo modo puoi facilmente distinguere tutti i dettagli.
Questa mappa sembra incredibile in dimensioni fino a 90 pollici (230 cm). Se stai cercando una mappa più grande, per favore contattaci.
Il modello nelle immagini dell'annuncio sta tenendo la versione 18x24 pollici (45x60 cm) di questa mappa.
La quinta immagine dell'annuncio mostra un esempio del mio servizio di personalizzazione della mappa.
Se stai cercando qualcosa di leggermente diverso, dai un'occhiata alla mia collezione delle migliori vecchie mappe per vedere se qualcosa attira la tua attenzione.
Per favore contattami per controllare se una certa posizione, punto di riferimento o caratteristica è mostrata su questa mappa.
Questo sarebbe un meraviglioso regalo di compleanno, Natale, Festa del Papà, partenza dal lavoro, anniversario o per la casa per qualcuno delle aree coperte da questa mappa.
Questa mappa è disponibile come stampa giclée su carta opaca archiviata senza acidi, oppure puoi acquistarla incorniciata. La cornice è una semplice cornice nera che si adatta alla maggior parte degli stili. Ti prego di contattarci se desideri un colore o materiale della cornice diverso. Le mie cornici sono dotate di un acrilico museo super chiaro (perspex/acrylite), che è significativamente meno riflettente del vetro, più sicuro e arriverà sempre in perfette condizioni.
This map is also available as a float framed canvas, sometimes known as a shadow gap framed canvas or canvas floater. The map is printed on artist's cotton canvas and then stretched over a handmade box frame. We then "float" the canvas inside a wooden frame, which is available in a range of colours (black, dark brown, oak, antique gold and white). This is a wonderful way to present a map without glazing in front. See some examples of float framed canvas maps and explore the differences between my different finishes.
For something truly unique, this map is also available in "Unique 3D", our trademarked process that dramatically transforms the map so that it has a wonderful sense of depth. We combine the original map with detailed topography and elevation data, so that mountains and the terrain really "pop". For more info and examples of 3D maps, check my Unique 3D page.
Many of our maps and art prints are chosen as thoughtful gifts for homes, offices, studies and meaningful places.
Choose a framed option for the easiest ready-to-hang gift, or choose an unframed print if the recipient may prefer to select their own frame.
We make orders locally in 23 countries around the world, so gifts can often be produced close to the recipient. This helps them arrive faster, travel more safely, and avoid customs or import duty surprises.
- We can deliver directly to the recipient
- Framed pieces arrive ready to hang
- Unframed prints are carefully packed in a strong protective tube
- Almost every order is made locally, for faster, safer gifting
- 90-day returns give the recipient time to decide
If you are not sure what to choose, please contact us. We can help you pick the right map, size, finish or delivery option.
Most orders are made locally and delivered in around 2–3 working days, depending on the product, size and destination.
We print and frame maps and artwork in 23 countries around the world, so your order is usually made close to you or your recipient. That means faster delivery, less time in transit, and no customs or import duty surprises.
Personalised and customised pieces usually take an extra 1–2 working days, because we prepare your design and send it to you for approval before printing.
Very large framed orders can take a little longer, as they need extra care in production and delivery.
Every order is carefully packaged: unframed prints are sent in a strong protective tube, while framed pieces are securely packed with protective materials around the frame.
If you need your order by a particular date, please contact us before ordering. We’ll check the best production route and delivery option for your location.
Express delivery is available at checkout for most countries. Next-day delivery is available in the UK, US, Singapore and the UAE.
Your order is covered by our 90-day returns policy and 10-year guarantee.
Our standard frame is a gallery-style black ash hardwood frame, with a simple, modern look. It is approximately 20mm (0.8in) wide. You can also view some lovely customer photos of framed maps and art.
We use super-clear acrylic glazing, also known as Perspex or Acrylite, instead of traditional glass. It is lighter, safer, and has lower reflectivity, giving the artwork a clearer, cleaner appearance.
Six standard frame colours are available at no extra cost: black, dark brown, dark grey, oak, white, and antique gold. Custom framing and mounting/matting is also available for customers looking for something more specific.
Most maps, art prints, and illustrations are also available as a framed canvas. We use matte cotton canvas, stretch it over a sustainably sourced wooden box frame, and then float the piece within a wooden outer frame. The finished result is beautifully presented, with no glazing between you and the artwork.
All frames are supplied ready to hang, with either string or brackets fitted to the back. Very large frames will include heavy-duty hanging plates and/or a mounting baton. If you have any questions, please get in touch.
We can also supply old maps and artwork on canvas, foam board, cotton rag, and other materials.
If you would prefer to frame your map or artwork yourself, please read our size guide before ordering.
Every Unique Maps piece begins with an authentic cartographic source or an original design from our London studio.
For our historic maps, we source rare originals from libraries, archives, auction houses and private collections around the world. We carefully restore each map for print—repairing age-related damage, balancing colour and improving clarity while preserving its original detail, texture and character.
Once restored, the map is prepared for your chosen size and finish. Your piece is then printed and, where selected, framed close to its delivery destination.
Our map prints use acid-free 200gsm archival matte paper and fade-resistant pigment inks, creating a rich, non-glossy finish designed to last. Framed maps use crystal-clear optical acrylic and arrive ready to hang.
Canvas, cotton-rag and other specialist presentations are also available. Learn more about our materials and finishes.
Personalising your map
You can add a short title or dedication, mark one meaningful place, or request one considered visual detail. For personalised designs, we send a proof before printing and you can request changes before approval.
For more complex bespoke commissions, contact our design team.
Original or Aged
Choose Original for true-to-source colour, or Aged for a warmer, richer antique character created with our specialist ageing process. See examples of our Aged maps.
Se non sei soddisfatto del tuo ordine per qualsiasi motivo, contattami per un rimborso senza problemi. Si prega di consultare la nostra politica di reso e rimborso per ulteriori informazioni.
Sono molto sicuro che ti piacerà la tua mappa restaurata o la stampa d'arte. Lo faccio dal 1984. Sono un venditore Etsy a 5 stelle. Ho venduto decine di migliaia di mappe e stampe d'arte e ho oltre 5.000 recensioni reali a 5 stelle.
Utilizzo un processo unico per restaurare mappe e opere d'arte che richiede molto tempo e lavoro. Trovare le mappe e le illustrazioni originali può richiedere mesi. Utilizzo tecnologia all'avanguardia e incredibilmente costosa per scannerizzare e restaurarle. Di conseguenza, garantisco che le mie mappe e stampe d'arte siano superiori alle altre - ecco perché posso offrire un rimborso senza problemi.
Quasi tutte le mie mappe e stampe d'arte sembrano fantastiche a grandi dimensioni (200 cm, 6,5 piedi+) e posso anche incorniciarle e consegnarle a te, tramite un corriere speciale per oggetti di grandi dimensioni. Contattami per discutere delle tue esigenze specifiche.
Or try searching for something!


